 Fig. 1:
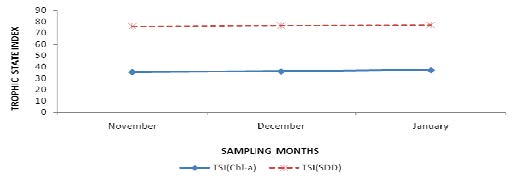
 Monthly trophic state indices calculated from Secchi disk transparency (SDD) and Chlorophyll-a (Chl-a) for Kuinet (chepkongi) dam.
 Fig. 2:
 Net primary productivity variations of Kuinet (Chepkongi) Dam recorded during the three sampling month
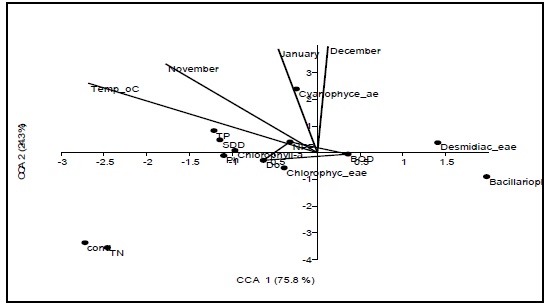 Fig. 3:
 Canonical correspondence for the phytoplankton cells and the physico-chemical variables
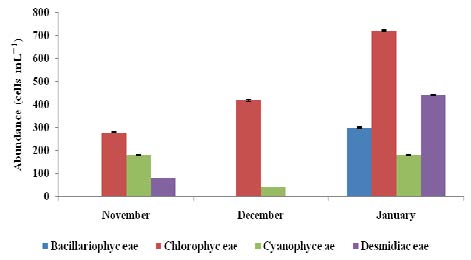 Fig. 4:
 : Mean ± SE Phytoplankton abundance during the three sampling months in Kuinet (Chepkongi) Dam.
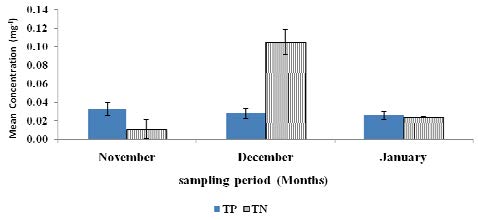 Fig. 5:
 Mean concentrations of total phosphorus (TP) and total nitrates in the Kuinet (Chepkongi) Dam recorded during the three sampling months.
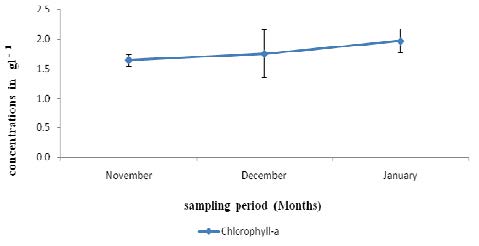 Fig. 6:
 Concentrations of chlorophyll-a Kuinet (Chepkongi) Dam recorded during the three sampling months.
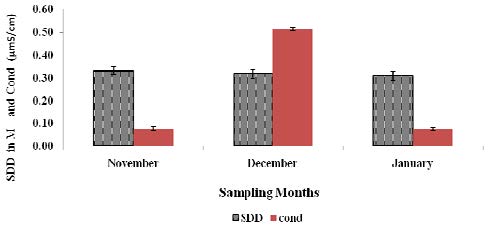 Fig. 7:
 Mean Secchi depth (SDD) and conductivity in Kuinet (Chepkongi) Dam recorded during the three sampling months.
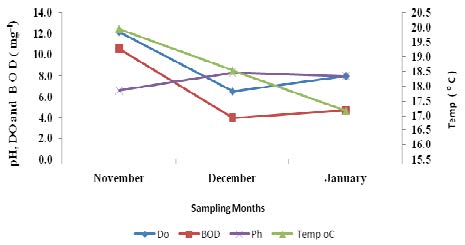 Fig. 8:
 DO, BOD concentrations and Temperature, pH presentations of Kuinet (Chepkongi) Dam recorded during the three sampling months.
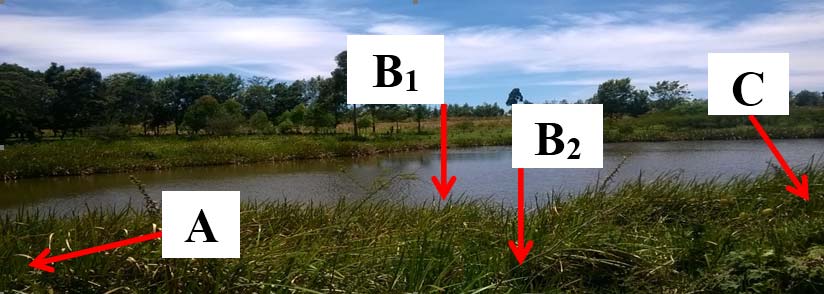 Fig. 9:
 Sampling sites in kuinet (Chepkongi) Dam
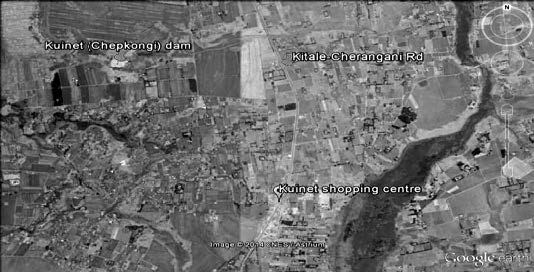 Fig. 10:
 Location of Kuinet (Chepkongi) Dam Satellite image (Source: Google Earth).