International Journal of Fisheries and Aquatic Studies
2016, Vol. 4, Issue 3, Part A
Defining the nitrogen fixation community size, structure and relevancy in Nile tilapia aquaculture pond waters
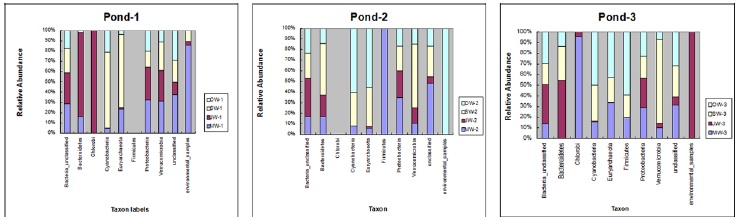 Fig. 1:
 Phylum Distribution Bar graphs for monthly sampled microbial communities in Ponds 1, 2 and 3 of Yi Xing city, China
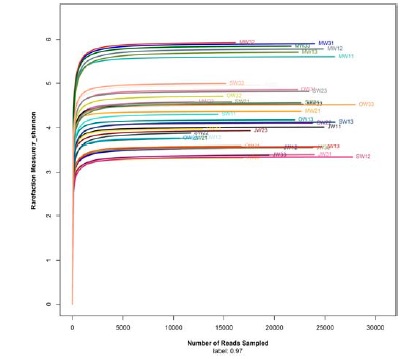 Fig. 2:
 Showing Rare-fraction measures within the ponds analyzed with the r_Shannon index
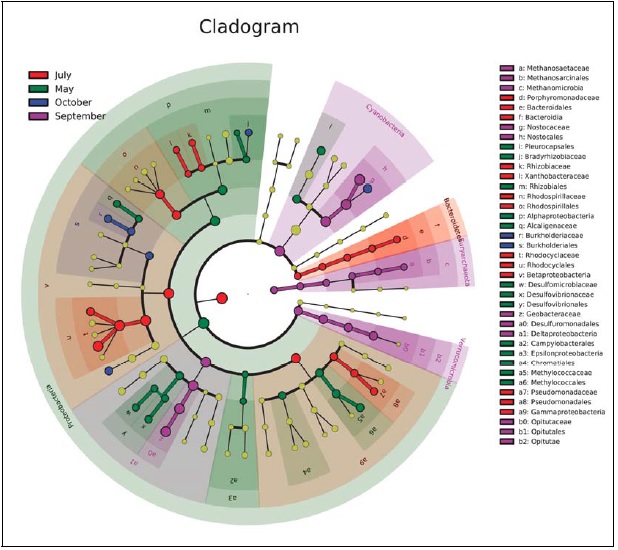 Fig. 3:
 Cladogram chart showing microbial representation within ponds 1, 2 and 3stocking Densities
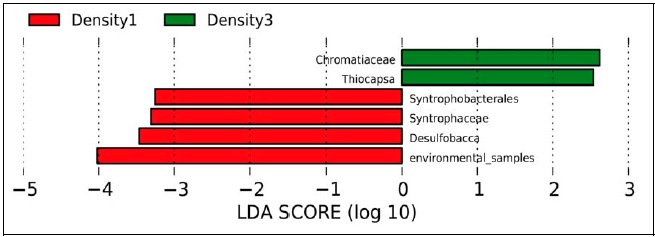 Fig. 4:
 Bacterial clades, showing statistically significant and biological consistent microbial differences in P1 and P3Fish densities
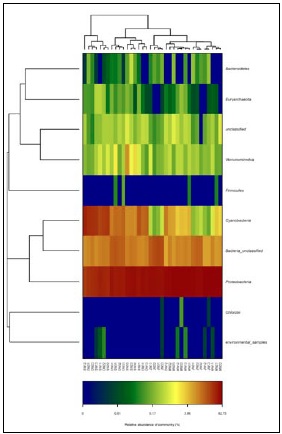 Fig. 5:
 Heat chart showing hierarchical cluster at the phylum level of microbiota communities within Tilapia grow out ponds in Yi Xing.
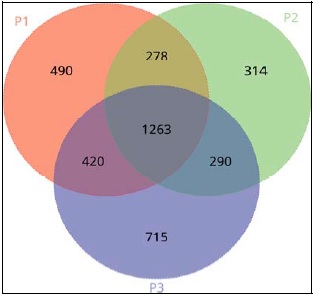 Fig. 6:
 Venn diagram displaying overlaps between genus groups of microbial communities within Tilapia ponds at different Stocking Densities
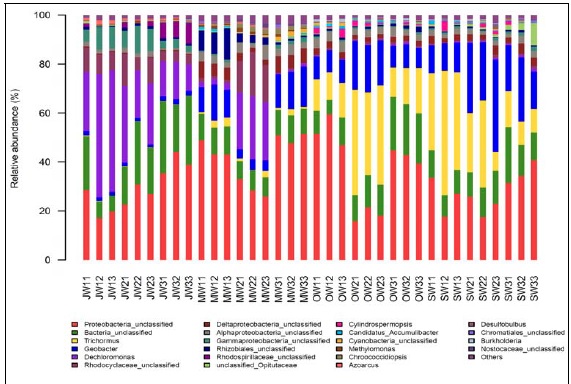 Fig. 7:
 Relative Abundance of genus distribution of Bacteria within the sampled sites of Ponds 1, 2 and 3 in Yi Xing
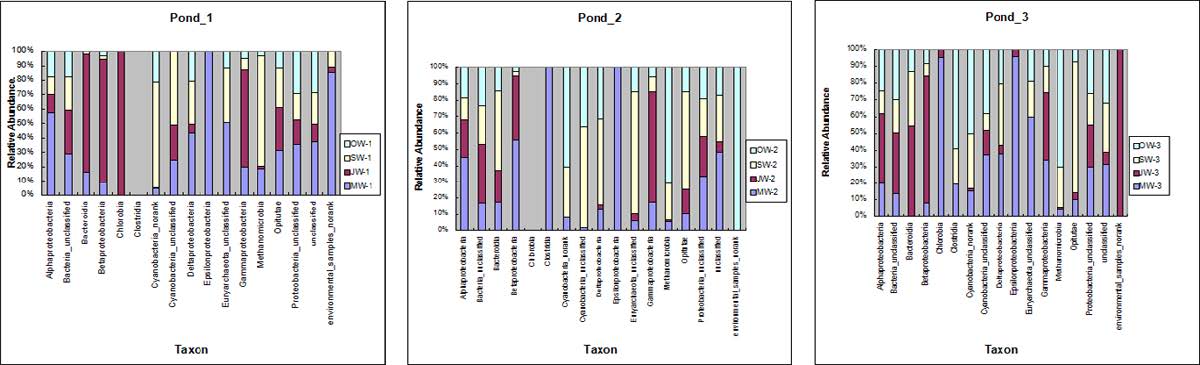 Fig. 8:
 Class Distribution Bar graphs for microbial communities in Ponds 1, 2 and 3 of Yi Xing city, China.
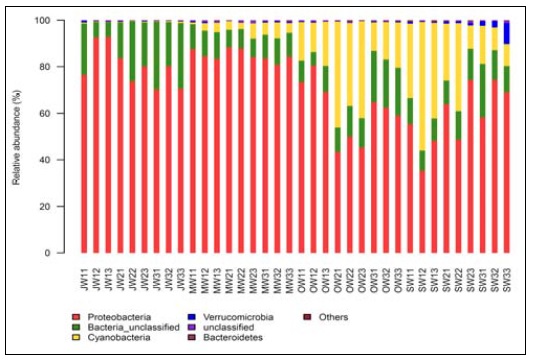 Fig. 9:
 Phylum Distribution Bar graphs for sampled microbial communities in Ponds 1, 2 and 3 of Yi Xing city, China